Blog
2021’s A level grades – what’s in a number?
Dennis Sherwood
Founder, Silver Bullet
Read the blog
Originally published 16 September, revised 20 September.
On 7 September 2021, the Education Committee held a hearing with Schools’ Minister Nick Gibb; DfE Permanent Secretary, Susan Acland-Hood; and Ofqual’s Acting Chair, Ian Bauckham, and Chief Regulator, Simon Lebus. During the meeting, David Johnston, the MP for Wantage, asked why “top grades had gone up 6% in the state sector, but 9% in the independent sector”.
Nick Gibb replied that “the percentage increase in the proportion of top grades awarded within the independent sector was 15.2%, but in the state sector this was 18%” (almost – Mr Gibb’s response was not quite as clear as that! Click on about 10:36:00 here).
9% is indeed a bigger number than 6%, as 18% is bigger than 15.2% — all of which led to a (to my mind) very muddled interplay between Mr Johnston and Mr Gibb about the “attainment gap between the state and the independent sectors”.
This was a rather more genteel discussion than as implied, for example, by headlines such as Private schools see huge rise in A* grades as ‘inequality’ gap with state sector grows which has the subtext “independent schools pull yet another fast one”. But the question “did the independent schools benefit, possibly unfairly, from the upheavals of the last two years?” rumbles on, as it did in 2020 in general, and in particular in relation to what were then called “small cohorts”.
So what does the data show? And, more importantly, what does it mean?
For this year’s results, the important numbers are contained in Tables 6, 7 and 8 of Ofqual’s report entitled Summer 2021 results analysis and quality assurance, published on 20 August 2021.
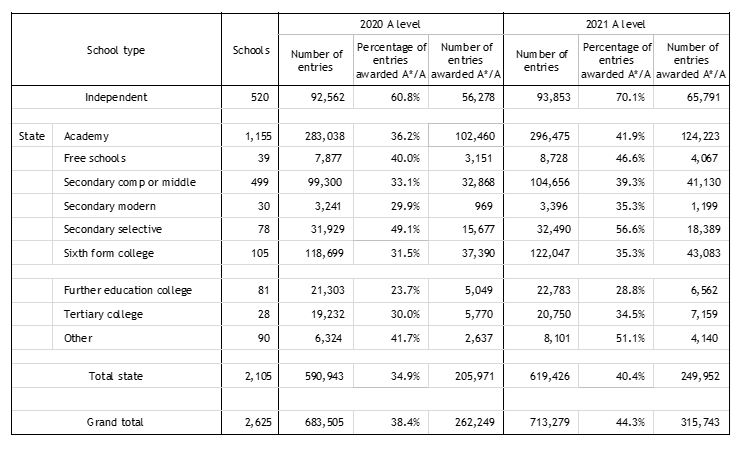
Table 1: Data on A level entries, by school type, 2020 and 2021
In this table, the numbers of schools and entries, and the percentages of A* and A awards, are taken directly from Ofqual’s report; the numbers of entries awarded A* and A have been calculated by myself, for I often find it more informative to consider numbers rather than percentages.
So, for example, Table 1 shows that in 2020, 205,971 state school entries were awarded top grades, as compared to 56,278 independent school entries, this being a ratio of 3.66 to 1; in 2021, this ratio increased to 3.80, suggesting a greater improvement in the state sector than in the independent sector.
Table 2 shows some inferences from the data in Table 1:
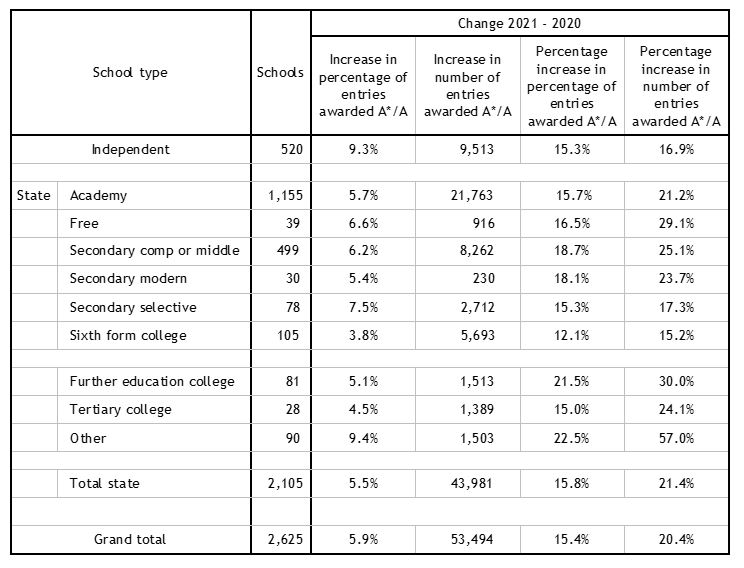
Table 2: Some key changes, 2021 compared to 2020
The columns in this table have been calculated as:
Increase in percentage of entries awarded A*/A: This is the difference between the 2021 and 2020 percentage of entries awarded A*/A columns in Table 1, for example, for the independent sector, 70.1% – 60.8% = 9.3 percentage points.
Increase in number of entries awarded A*/A: This is the difference between the 2021 and 2020 number of entries awarded A*/A columns in Table 1, for example, for Academy schools, 124,223 – 102,460 = 21,763.
Percentage increase in percentage of entries awarded A*/A: This is the increase in percentage of entries awarded A*/A, as shown two columns to the left in this table (Table 2), expressed as a percentage of the percentage of entries awarded A*/A in 2020, as shown in Table 1. So, for example for the independent sector, in 2020, the percentage of entries awarded A*/A was 60.8% (Table 1), and this increased by 9.3 percentage points in 2021 (Table 2). The percentage increase in percentage of entries awarded A*/A is therefore (9.3/60.8) x 100 = 15.3%.
Percentage increase in number of entries awarded A*/A: This is the increase in the number of entries awarded A*/A, as shown two columns to the left in Table 2, expressed as a percentage of the number of entries awarded A*/A in 2020, as shown in Table 1. As an example, for Academy schools, the number of entries awarded A*/A in 2020 was 102,460 (Table 1), and this increased by 21,763 in 2021 (Table 2). The percentage increase in number of entries awarded A*/A is therefore (21,763/102,460) x 100 = 21.2%.
These numbers explain much of the muddle both this year and last.
The question asked at the Select Committee by David Johnston focused on the first (main) column in Table 2: the figures of 9.3% for the independent sector (Mr Johnston rounded this to 9%), and (probably) 5.5% for the state sector (which he rounded to 6%).
In his reply, Nick Gibb was using figures from the third (main) column in Table 2, the percentage increase in the percentage of entries awarded top grades: 15.3% for the independent sector (Mr Gibb quoted 15.2%), and 18% for the state sector (my number in Table 2 is 15.8%; perhaps the civil servant who provided Mr Gibb’s briefing cherry-picked a subset of the various state school categories?).
And it’s the use of different data sets that is the problem.
If you compare the ‘independent’ and ‘total state’ rows of Table 2, you come to different conclusions, depending which column you are looking at.
The first main column, the absolute increase in the percentage of entries awarded top grades, shows that independent schools increased (absolutely) by 9.3 percentage points, whereas state schools increased by (only) 5.5 percentage points.
But the third main column, the relative increase in the percentage of top grades awarded, using the 2020 percentage as the reference point, shows that the independent sector increased by 15.3%, and the state sector by 15.8% (my figure, that used by Nick Gibb was 18%); either way, this can be interpreted as evidence that the state sector’s grades improved by more than the independent sector’s – an inference supported by the various categories within the state sector, such as secondary comprehensive or middle (18.7%), FE (21.5%) and that mysterious ‘other’ (22.5%).
Which interpretation is correct?
That’s a good question to explore with your A level Maths sets, if not, for example, A level Economics, Political Studies or Critical Thinking.
In my view, percentages can be slippery, especially changes in percentages, which can be expressed either in absolute terms (as in the first main column of Table 2) or relative to some base figure (as in the third main column in Table 2). Which is why I like real numbers. Like the numbers shown in the second main column of Table 2: at independent schools, 9,513 more entries were awarded A*/A in 2021 than in 2020; likewise, in the state sector, 43,981 more entries.
Furthermore, the right-hand column shows that those additional 9,513 independent sector entries represent an increase of 16.9% relative to the number awarded A*/A in 2020, and the additional 43,981 state sector entries represent an increase of 21.4% relative the corresponding state sector entries in 2020.
My conclusion?
It’s all about numeracy…
Date
16 September 2021
Share


Related Articles